Debug the program
Contents
Debug the program#
Debugging can be slow and painful if you don’t have the right tools for the task. I recommend using the gdb based debugger in vscode to debug your fortran program. There are definitely more choices of debugger on the market, for example, if you have relatively fast internet connection, then you may consider open a gui software like totalview on the server to debug your program, but that’s not as convenient as vscode in my opinion.
Step 1: Build the program#
This step is exactly the same as how it is done in Build the source code.
Step 2: Choose the launcher#
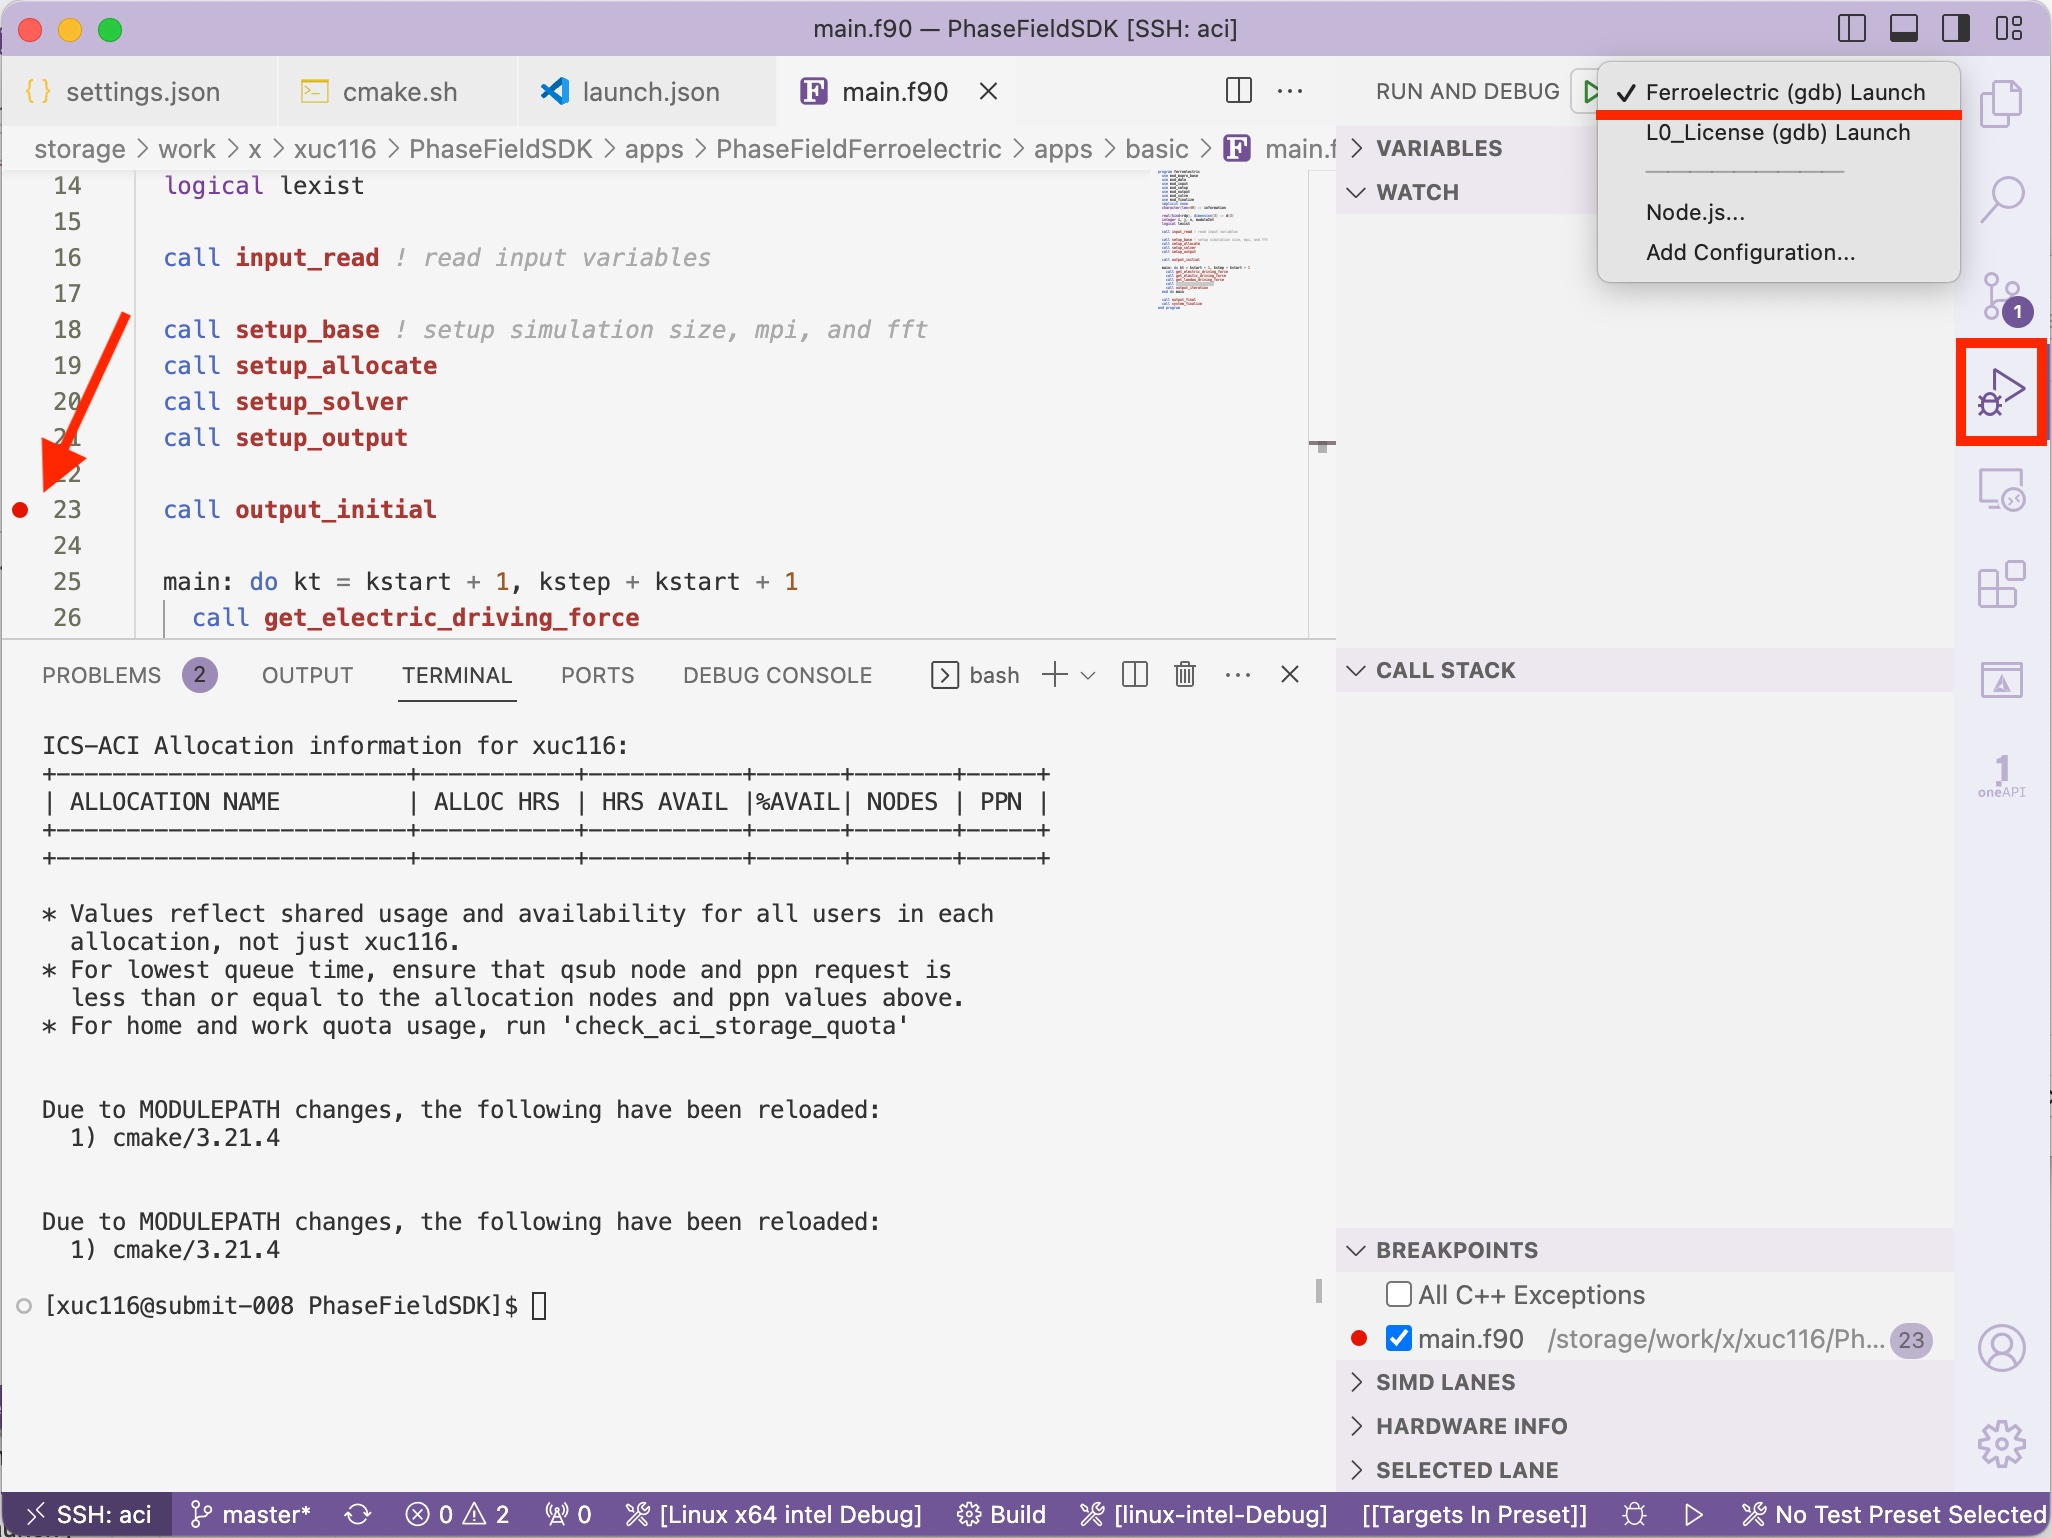
Click the Run and Debug icon on the vertical toolbar
Use the dropdown to select a launcher
Click on the left to the code line number for any file in your program to set the break points.
Step 2.5: Or create the launcher#
If there is no launcher that fulfill you need, then you may create a new one yourself.
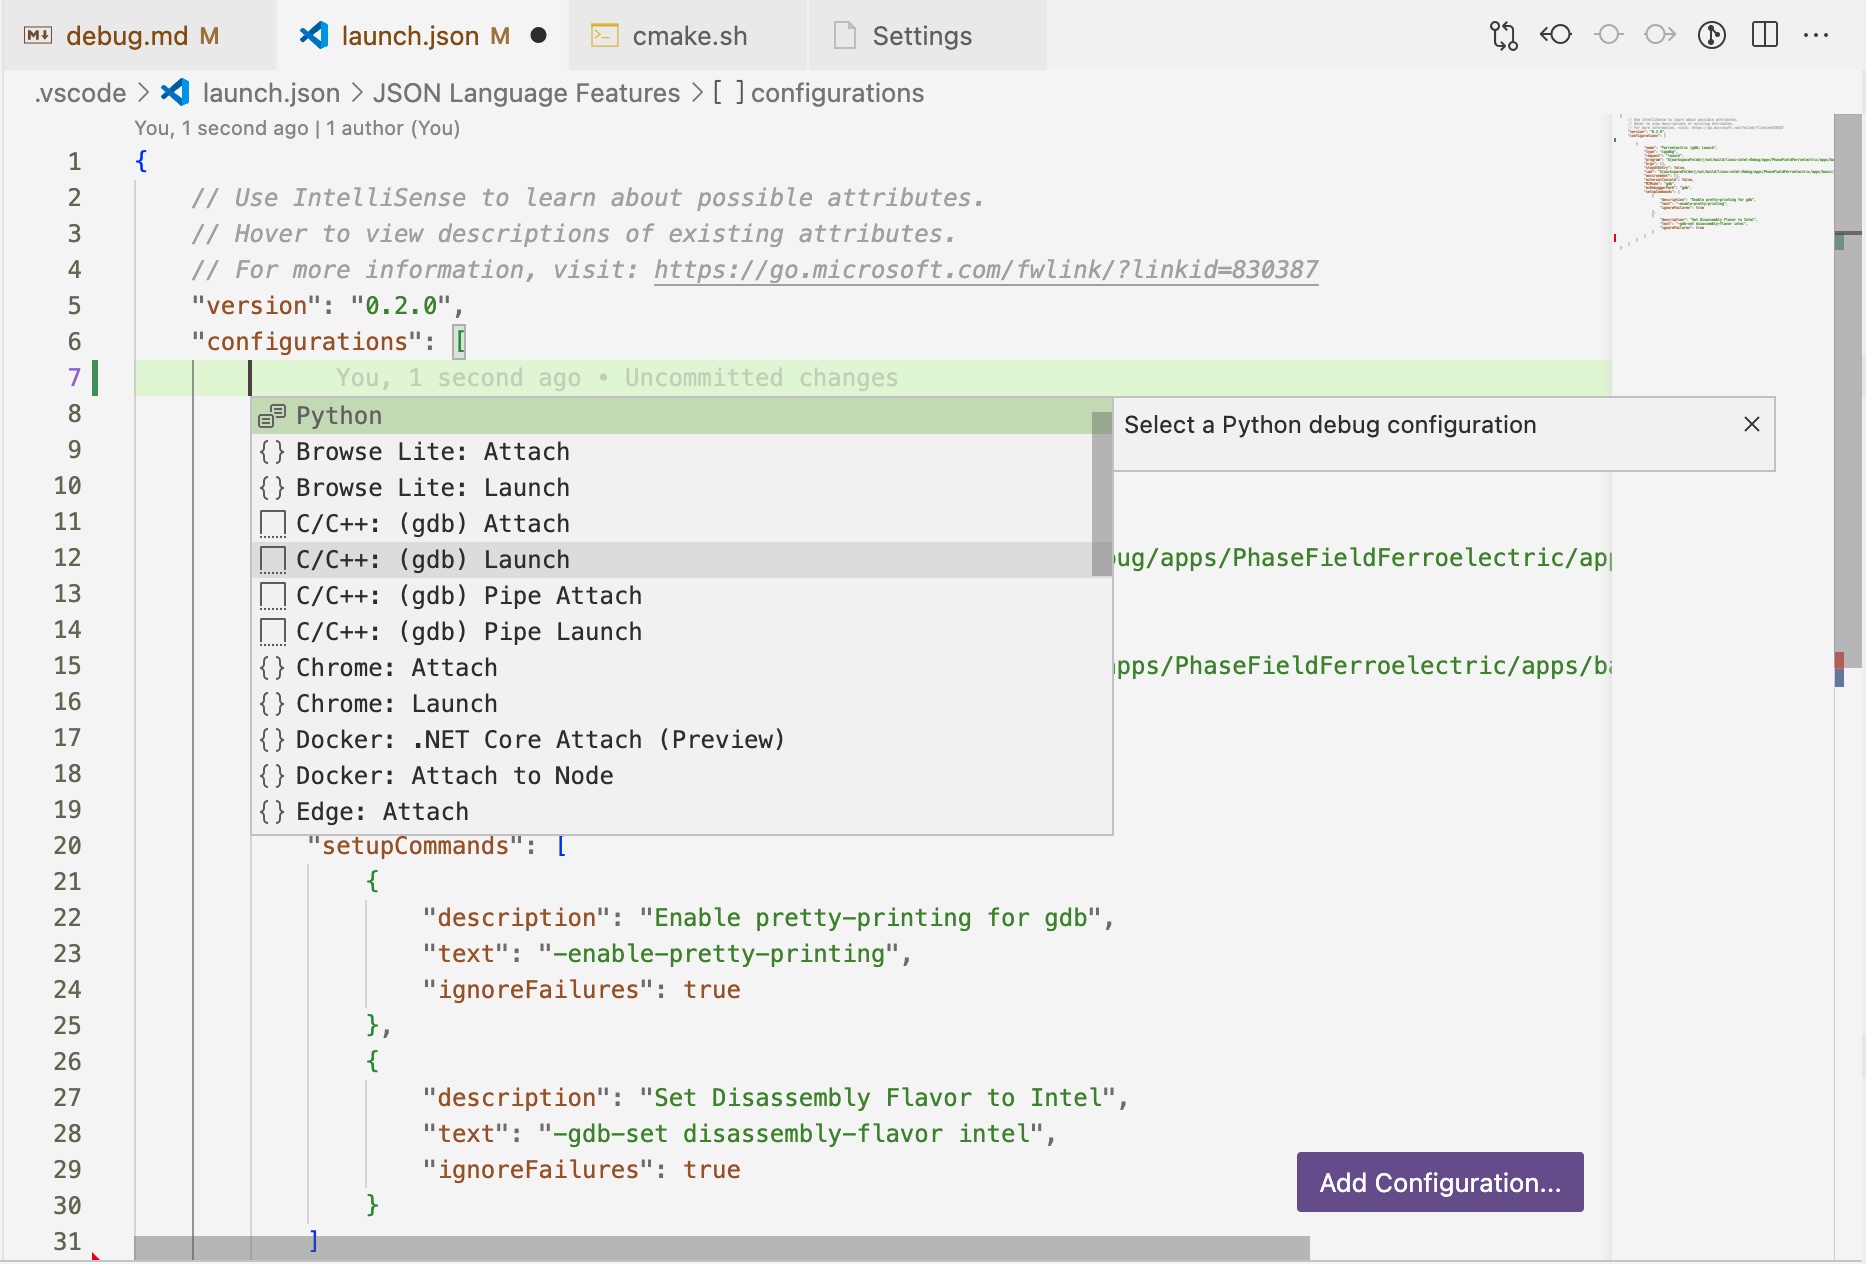
Choose Add Configuration … in the RUN AND DEBUG dropdown menu. This will open the .vscode/launch.json file for you to edit.
Select C/C++: (gdb) Launch, vscode will give a template to work with
Edit the name (name for this launch), program (the executable), and cwd (current working directory for the program to run from)
Step 3: Start debugging#
Click the green triangle button right of RUN AND DEBUG to start the debugger. Then you should see outputs start printing to the terminal and stop at the first break point you set.
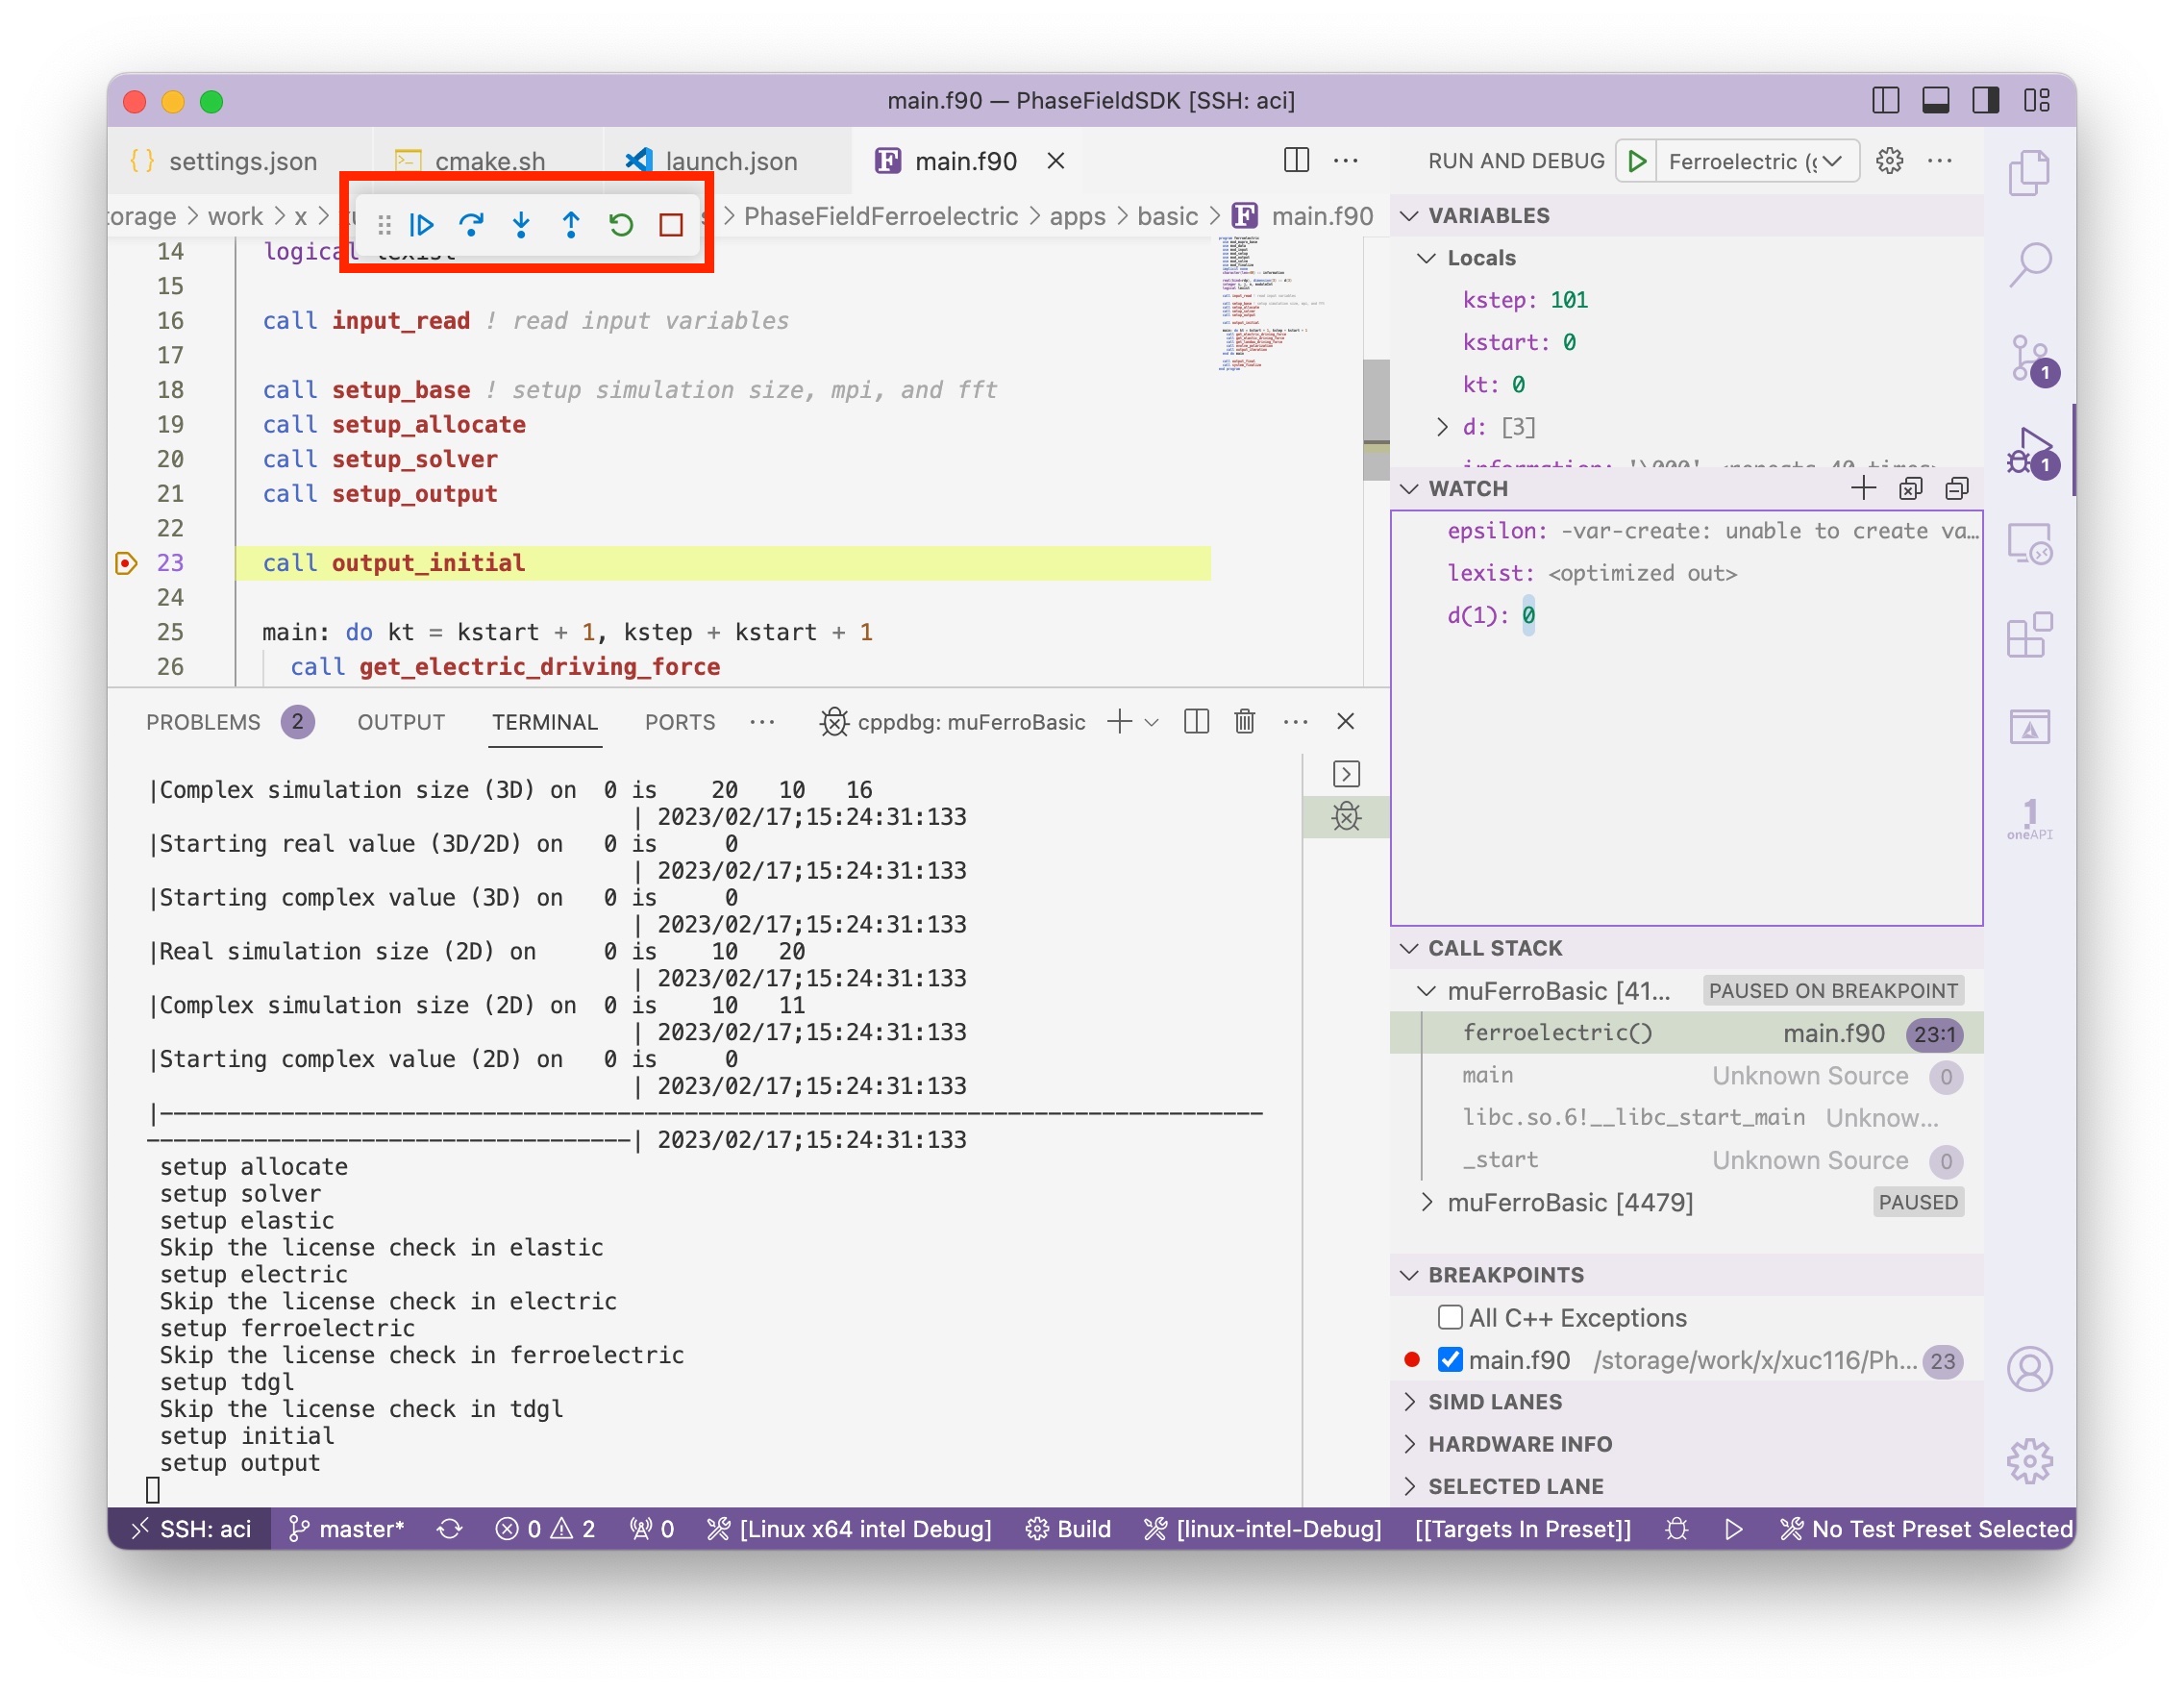
You can navigate through the code using the floating buttons (from left to right, continue, step over, step into, step out, restart, stop).
You can track variables as the program executes by double clicking in the WATCH area, or click the + button on the WATCH panel, then enter you variables name.
You can use expressions in the WATCH, such as use d(1) to get the first element of array d, use sizeof(d) to get the memory size of array d.